
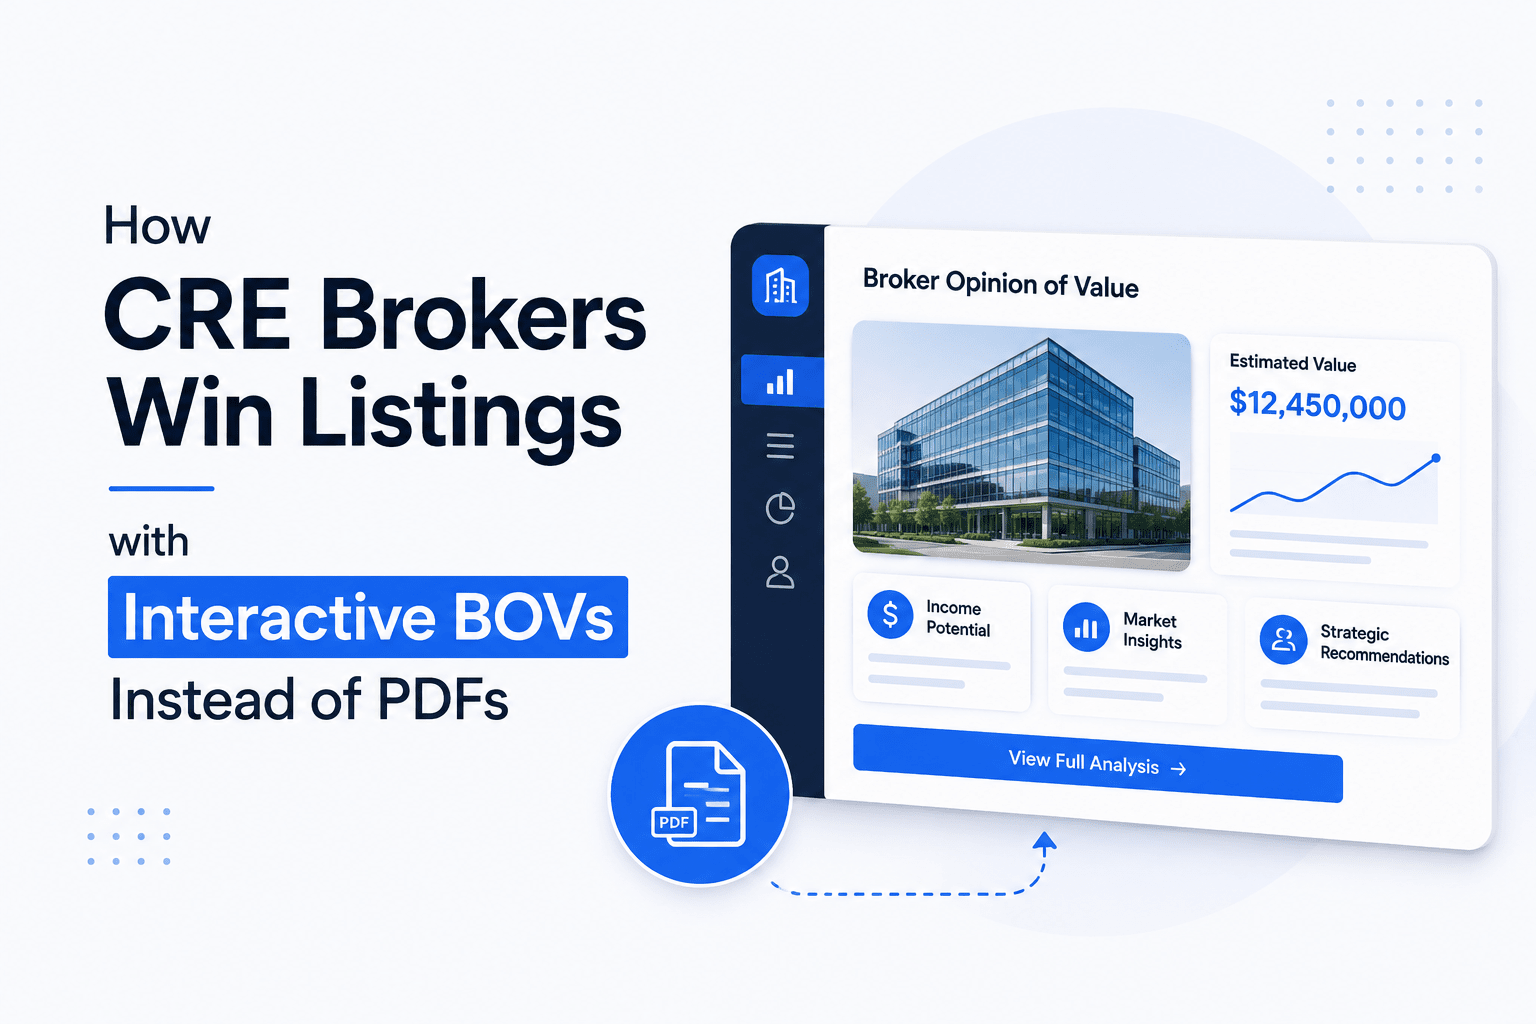
How CRE Brokers Win Listings with Interactive BOVs Instead of PDFs
Commercial real estate brokerage has always been a relationship-driven business, but relationships alone are no longer enough to consistently win listing assignments. As property owners become more sophisticated and competition among brokerage firms intensifies, brokers must find new ways to stand out. This is where Interactive CRE Listing Presentations are changing the game. Instead of relying solely on static PDFs, brokers can deliver dynamic, data-driven experiences that help owners engage with valuation assumptions, explore scenarios, and make more informed decisions.
For decades, the standard approach has remained largely unchanged. Brokers prepared a Broker Opinion of Value (BOV), assembled comparable sales, created market analysis slides, added a marketing plan, and delivered everything as a PDF. While polished PDFs still have value, they are increasingly struggling to capture attention in a world where clients expect dynamic digital experiences. This shift is creating a significant opportunity for brokers who adopt Interactive CRE Listing Presentations as part of their listing strategy.
Instead of sending static documents, brokers can now provide property owners with interactive valuation platforms that allow them to explore assumptions, test scenarios, analyze buyer pools, and engage with the information in real time. The experience becomes more transparent, more memorable, and far more persuasive than a traditional PDF presentation.
Property owners no longer want to simply read recommendations. They want to understand them, challenge them, and validate them themselves. Interactive BOVs make that possible.
Why CRE Listing Presentations Are Evolving
The listing presentation is one of the most important moments in the brokerage process. It is the point where owners decide which broker they trust to represent a potentially multi-million-dollar asset.
Want to see this concept in action? The video below walks through how brokers are using AI-generated interactive experiences to stand out during listing presentations and win more assignments.
Historically, brokers competed primarily on three factors:
-
Relationships
-
Track record
-
Presentation quality
Today, there is a fourth factor:
-
Client experience
Owners increasingly compare their brokerage interactions to the digital experiences they receive elsewhere. Whether they are using investment platforms, financial dashboards, or business intelligence tools, they have become accustomed to interactive data and real-time insights.
A static PDF often feels outdated by comparison.
The Problem with Traditional PDFs
PDFs have several inherent limitations.
They present information in a fixed format. Once created, the analysis cannot adapt to questions, alternative assumptions, or different ownership objectives.
For example, if an owner asks:
“What happens if cap rates increase by 50 basis points?”
The answer may require flipping through multiple pages or conducting additional calculations.
An interactive presentation provides that answer instantly.
Similarly, if ownership wants to compare a sale today versus holding for three years, a traditional PDF may require supplemental analysis. An interactive BOV can model the scenario immediately.
The challenge is not that PDFs are ineffective. The challenge is that they cannot provide the level of engagement modern clients increasingly expect.
What Is an Interactive BOV?
A Broker Opinion of Value has traditionally been a document that estimates a property’s value and outlines a broker’s recommended disposition strategy.
An interactive BOV transforms this concept into a digital experience.
Instead of viewing static pages, owners interact with dashboards, valuation models, maps, calculators, charts, and scenario-planning tools.
The purpose remains the same:
-
Demonstrate expertise
-
Establish credibility
-
Recommend pricing
-
Win the listing assignment
However, the delivery method becomes significantly more engaging.
Core Components of an Interactive BOV
Most successful interactive BOVs include:
-
Executive summary dashboard
-
Property overview
-
Interactive valuation models
-
Comparable sales analysis
-
Buyer targeting insights
-
Marketing strategy timeline
-
Financial calculators
-
Scenario planning tools
Rather than receiving information passively, owners actively participate in the valuation process.
Traditional BOV vs Interactive BOV
| Category | Traditional PDF BOV | Interactive BOV |
|---|---|---|
| User Experience | Passive | Active |
| Scenario Testing | No | Yes |
| Mobile Accessibility | Limited | Excellent |
| Engagement Level | Moderate | High |
| Data Visualization | Static | Interactive |
| Buyer Analysis | Basic | Advanced |
| Market Insights | Fixed | Dynamic |
| Memorability | Moderate | High |
The result is a presentation that feels more like a strategic consultation than a sales pitch.
Why Property Owners Prefer Interactive Experiences
Owners often receive proposals from multiple brokerage firms.
In many cases, those proposals look remarkably similar.
Each broker provides:
-
Market statistics
-
Comparable sales
-
Valuation recommendations
-
Marketing plans
The information may differ slightly, but the format remains largely identical.
Interactive presentations change that dynamic.
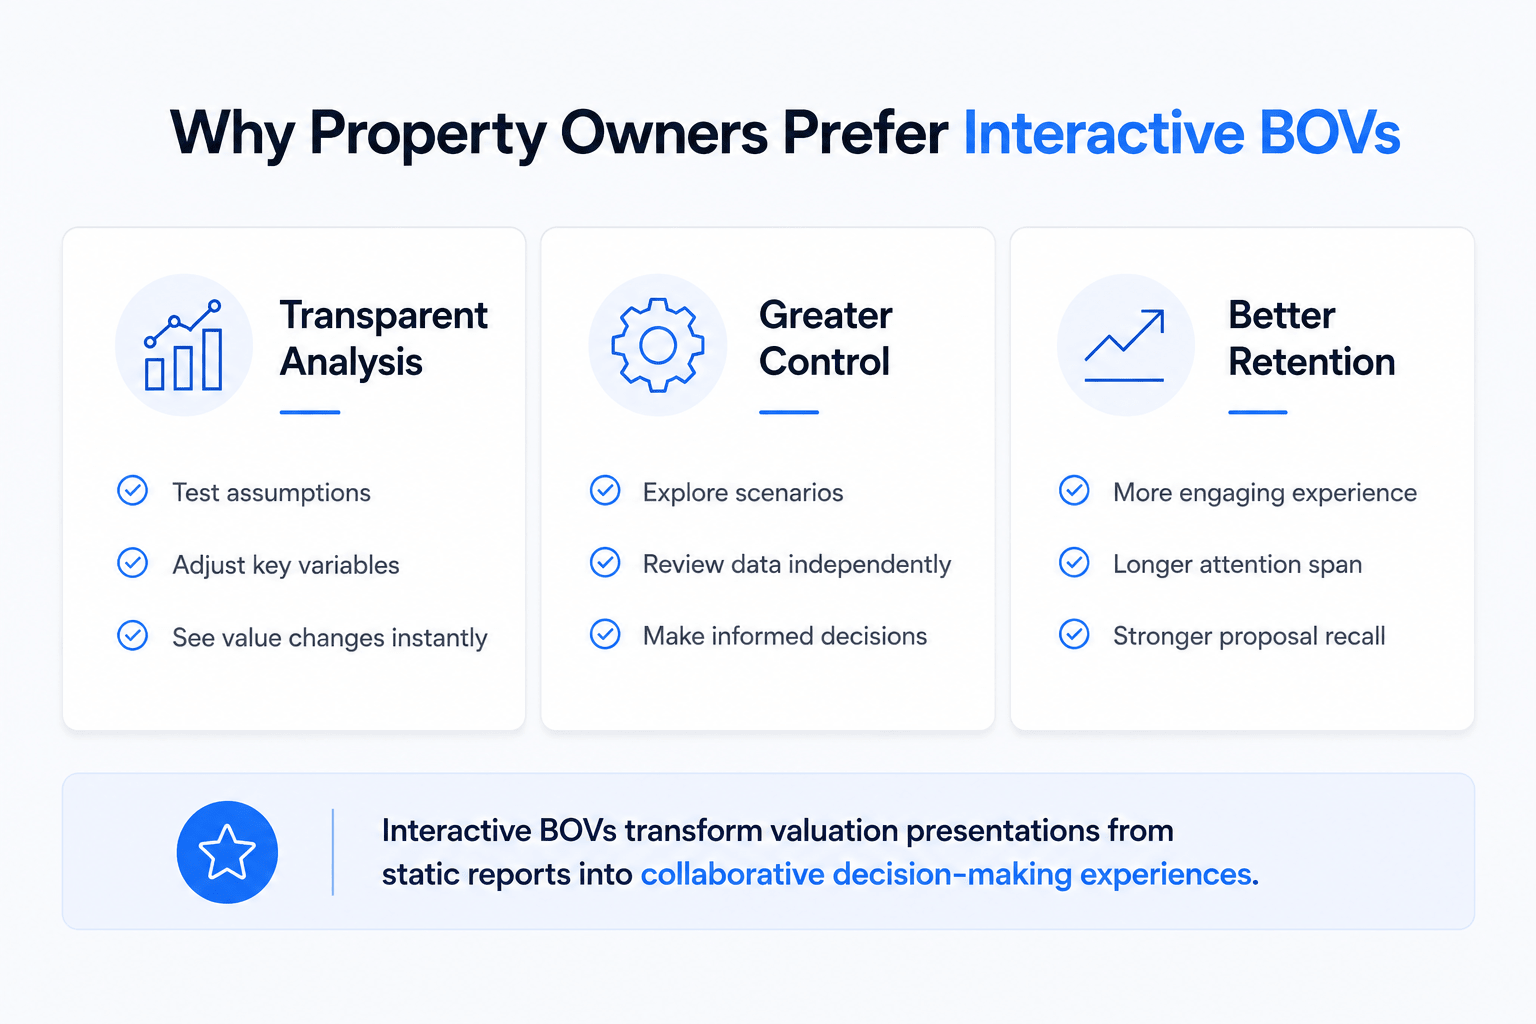
Increased Transparency
Transparency is one of the strongest drivers of trust. When owners can explore assumptions themselves, they gain confidence in the analysis.
For example, they can adjust:
-
Exit cap rates
-
Vacancy assumptions
-
Rental growth
-
Expense growth
-
Hold periods
As values update instantly, owners develop a deeper understanding of what drives pricing.
Greater Control
Property owners appreciate having control over the analysis process. Instead of relying solely on broker recommendations, they can validate conclusions independently.
This creates a collaborative experience rather than a one-sided presentation.
Better Retention
Interactive content is naturally more memorable. Owners spend more time engaging with information when they can explore it directly.
That increased engagement often translates into stronger recall during broker selection.
The Psychology Behind Winning More Listings
Winning listings are not just about delivering information. It is about influencing decision-making. Interactive presentations align closely with several key psychological principles.
Ownership Bias
People trust conclusions more when they arrive at them themselves.
When owners manipulate valuation assumptions and see the outcomes firsthand, they feel greater ownership over the conclusions. This significantly increases buy-in.
Transparency Effect
Visible assumptions reduce skepticism. Owners are naturally cautious when evaluating recommendations involving significant financial decisions.
Interactive models expose the reasoning behind every conclusion. This openness strengthens credibility.
Commitment Through Engagement
The more time owners spend engaging with a presentation, the more invested they become. A PDF may receive ten minutes of attention.
An interactive BOV may receive an hour or more. That difference can dramatically impact perception.
Essential Features Every Interactive BOV Should Include
Not every interactive presentation needs dozens of advanced features.
The best solutions focus on delivering practical value.
Executive Dashboard
The dashboard should provide immediate clarity.
Include:
-
Estimated property value
-
Recommended pricing strategy
-
Key investment highlights
-
Target buyer profile
-
Market positioning summary
This creates a strong first impression.
Interactive Valuation Lab
This is often the most compelling feature.
Owners can modify variables and immediately see the impact on value.
Popular inputs include:
-
Cap rate assumptions
-
Occupancy levels
-
Rent growth
-
Expense growth
-
Hold periods
Comparable Sales Explorer
Traditional comp tables are difficult to analyze.
Interactive maps improve usability by allowing owners to:
-
View nearby transactions
-
Filter by property type
-
Compare asset characteristics
-
Analyze sale pricing
Marketing Timeline
Owners want confidence that brokers have a clear execution plan.
An interactive timeline can visualize:
-
Launch preparation
-
Marketing rollout
-
Buyer outreach
-
Property tours
-
Offer deadlines
-
Closing milestones
Interactive Buyer Targeting Creates More Confidence
One of the strongest advantages of interactive presentations is the ability to demonstrate a buyer strategy.
Traditional BOVs often mention buyer categories without meaningful detail. Interactive BOVs can go much deeper.
Buyer Personas
Owners can review:
| Buyer Type | Typical Motivation |
|---|---|
| 1031 Exchange Buyer | Tax deferral |
| Private Investor | Cash flow |
| Value-Add Fund | Appreciation |
| Institutional Buyer | Portfolio growth |
| Family Office | Long-term hold |
This helps owners understand who is likely to acquire the asset.
Buyer Matching Analysis
Advanced presentations can display:
-
Historical acquisition patterns
-
Preferred markets
-
Target deal sizes
-
Investment criteria
This reinforces confidence in the broker’s marketing strategy.
Personalized Outreach Examples
Some brokers now include sample outreach campaigns tailored to specific buyers.
This demonstrates proactive planning before the listing agreement is even signed.
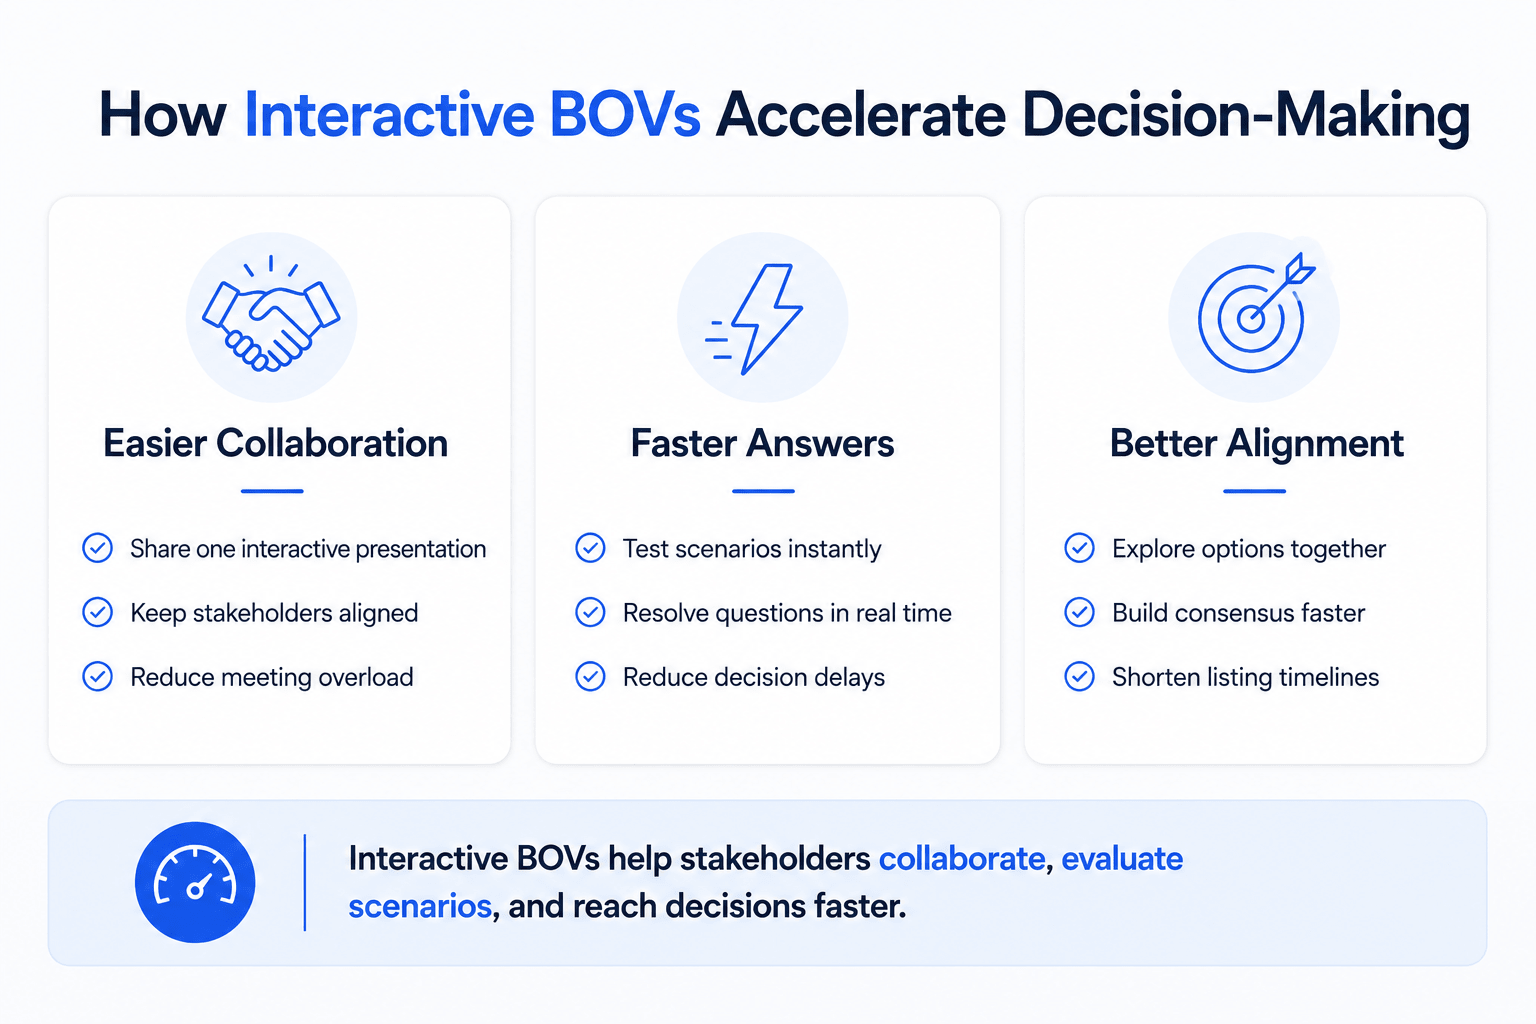
How Interactive BOVs Accelerate Decision-Making
Many listing assignments take weeks to finalize.
Interactive presentations help reduce friction throughout the decision process.
Easier Stakeholder Collaboration
Commercial properties often involve multiple decision-makers.
These may include:
-
Family members
-
Partners
-
Investors
-
Asset managers
-
Advisory boards
Interactive platforms simplify information sharing.
Everyone can access the same presentation without requiring multiple meetings.
Faster Question Resolution
Owners frequently ask:
-
What if interest rates increase?
-
What if rents decline?
-
What if we wait twelve months?
Interactive models answer these questions instantly.
This reduces delays and improves confidence.
Better Internal Alignment
When stakeholders explore scenarios together, alignment often occurs faster.
This can shorten listing decision timelines significantly.
Building Interactive CRE Listing Presentations With AI
The emergence of AI tools has dramatically lowered the barrier to creating sophisticated interactive presentations.
Previously, building custom digital experiences often required:
-
Software developers
-
Designers
-
Data analysts
-
Significant budgets
Today, brokers can create impressive interactive presentations much more efficiently.
For example, many of the same workflows used to create interactive BOVs can also be applied to building AI-powered brokerage websites, allowing brokers to create custom client experiences without relying on expensive development teams.
Modern Workflow
A typical workflow includes:
-
Gather property information
-
Organize financial data
-
Upload market research
-
Define presentation goals
-
Generate a presentation framework
-
Build interactive features
-
Verify all calculations
-
Share with ownership
The process can often be completed in a fraction of the time required for traditional custom development.
Data Sources
Common inputs include:
| Data Source | Purpose |
|---|---|
| Rent Roll | Revenue analysis |
| T12 Statement | Expense review |
| Market Reports | Market positioning |
| Comparable Sales | Valuation support |
| Property Photos | Visual presentation |
| GIS Data | Mapping analysis |
| Demographics | Market insights |
The quality of inputs directly impacts the quality of outputs.
Common Mistakes Brokers Should Avoid
Technology alone will not win listings. Execution remains critical.
Overcomplicating the User Experience
The presentation should be intuitive. Owners should not require instructions to navigate the platform.
Simple experiences consistently outperform complicated ones.
Prioritizing Design Over Strategy
A beautiful presentation cannot compensate for weak analysis. Owners care more about insights than animations.
Including Excessive Data
Too much information creates confusion.
Focus on:
-
Value drivers
-
Market opportunities
-
Buyer strategy
-
Execution plan
Everything else should support those core objectives.
Failing to Verify Calculations
Accuracy remains non-negotiable. Every number should be reviewed carefully before presentation. Trust can be lost instantly if owners identify errors.
The Competitive Advantage Available Today
Interactive BOVs are still relatively uncommon across much of the brokerage industry. That creates a temporary opportunity.
Early adopters can stand out because many competitors continue relying solely on PDFs. However, this advantage will not last forever.
As technology becomes more accessible, interactive presentations will likely become standard practice.
The brokers who adopt them today will gain valuable experience before widespread adoption occurs.
Current Competitive Benefits
| Advantage | Impact |
|---|---|
| Differentiation | More memorable presentations |
| Engagement | Longer owner interaction |
| Transparency | Increased trust |
| Efficiency | Faster decision-making |
| Innovation Perception | Stronger brand positioning |
| Collaboration | Better stakeholder alignment |
These benefits directly influence listing conversion rates.
What the Future Looks Like
Commercial real estate presentations are becoming increasingly digital.
Future innovations will likely include:
-
AI-generated valuation scenarios
-
Real-time market feeds
-
Automated buyer recommendations
-
Predictive pricing models
-
Interactive underwriting tools
-
Portfolio benchmarking dashboards
As these technologies mature, owners will increasingly expect interactive experiences as part of the listing process.
Brokers who invest in these capabilities now will be better positioned to meet future expectations.
Build Listing Presentations That Owners Actually Remember
The most successful brokers understand that winning listings is no longer just about delivering information. It is about creating an experience that helps owners understand the market, validate assumptions, and gain confidence in the recommended strategy. Interactive BOVs transform a traditional pitch into a collaborative decision-making tool that owners can engage with long after the presentation ends.
If you want to learn how leading brokers are using AI, interactive valuation tools, and modern marketing workflows to secure more assignments, join the AI for CRE Collective alongside 600+ CRE professionals who are actively testing these strategies in real deals. The easiest way to stay ahead of industry changes is to subscribe to the newsletter and learn from brokers already implementing these approaches successfully.
Conclusion
The traditional PDF BOV has served commercial real estate brokers for decades, but client expectations are changing.
Today’s owners want transparency, flexibility, and the ability to explore information on their own terms. Interactive CRE Listing Presentations deliver exactly that. They transform static analyses into engaging experiences that help owners understand valuation drivers, evaluate scenarios, and gain confidence in the broker’s expertise.
As competition for listings continues to increase, brokers who embrace interactive presentations will be better positioned to differentiate themselves, strengthen trust, accelerate decisions, and win more assignments. The future of listing presentations is not static documents. It is interactive experiences that turn information into engagement and engagement into listings.
FAQs Regarding How CRE Brokers Win Listings with Interactive BOVs Instead of PDFs
What is an interactive BOV in commercial real estate?
An interactive BOV (Broker Opinion of Value) is a digital, web-based property presentation that allows owners to engage with valuation assumptions, financial models, market data, comparable sales, and buyer strategies in real time. Unlike traditional PDFs, interactive BOVs let owners explore different scenarios and understand how various factors impact property value.
Key benefits include:
-
Real-time valuation adjustments
-
Interactive comparable sales analysis
-
Dynamic market insights
-
Better owner engagement
-
Improved transparency
Conclusion: Interactive BOVs transform static property valuations into engaging decision-making tools that help brokers stand out and win more listings.
Why are interactive BOVs more effective than traditional PDFs?
Interactive BOVs provide a significantly better user experience because owners can actively engage with the analysis instead of simply reading a document. They allow users to test assumptions, explore scenarios, and better understand valuation recommendations.
Major advantages include:
-
Higher engagement levels
-
Increased trust through transparency
-
Faster decision-making
-
Better information retention
-
Greater differentiation from competitors
Conclusion: Interactive BOVs create a more compelling and memorable experience that often leads to higher listing conversion rates.
How do Interactive CRE Listing Presentations help brokers win more listings?
Interactive CRE Listing Presentations help brokers differentiate themselves from competitors by offering a modern, transparent, and data-driven experience. Owners can interact with the broker’s analysis, which builds credibility and confidence in the recommended strategy.
Ways they help win listings:
-
Demonstrate expertise visually
-
Showcase analytical capabilities
-
Increase owner confidence
-
Encourage longer engagement
-
Improve presentation memorability
Conclusion: Brokers who provide interactive experiences often create stronger impressions and improve their chances of securing listing assignments.
What features should an interactive BOV include?
An effective interactive BOV should focus on the information owners care about most while making the experience easy to navigate and understand.
Recommended features include:
-
Executive summary dashboard
-
Live valuation sensitivity analysis
-
Interactive comparable sales maps
-
Buyer targeting profiles
-
Marketing timeline
-
Financial calculators
-
Scenario planning tools
Conclusion: The best interactive BOVs combine simplicity, transparency, and valuable insights that help owners make informed decisions.
Can interactive BOVs increase owner trust?
Yes. Trust is one of the biggest advantages of interactive presentations. By allowing owners to see and adjust assumptions themselves, brokers demonstrate transparency and confidence in their analysis.
Trust-building elements include:
-
Visible valuation assumptions
-
Real-time calculations
-
Scenario testing
-
Open methodology
-
Interactive financial models
Conclusion: Transparency helps reduce skepticism and strengthens confidence in both the analysis and the broker presenting it.
How long does it take to build an interactive BOV?
The time required depends on the complexity of the property and the features included. With modern AI tools and templates, many brokers can create functional interactive BOVs much faster than traditional custom-built solutions.
Factors that impact development time:
-
Property complexity
-
Data availability
-
Number of interactive features
-
Level of customization
-
Technology platform used
Conclusion: What once required weeks of development can now often be completed in a matter of hours or days.
What types of commercial properties benefit from interactive BOVs?
Interactive BOVs can be used across nearly every commercial real estate asset class because owners consistently value transparency and scenario analysis.
Common property types include:
-
Multifamily properties
-
Office buildings
-
Industrial assets
-
Retail centers
-
Self-storage facilities
-
Land development opportunities
Conclusion: Interactive presentations provide value across virtually all commercial real estate property types.
How can AI help create interactive BOVs?
AI tools can accelerate the creation of interactive BOVs by helping brokers organize data, generate content, build valuation models, and create web-based presentations.
AI applications include:
-
Data analysis
-
Market research summaries
-
Valuation modeling
-
Content generation
-
Scenario planning
-
Buyer targeting insights
Conclusion: AI significantly reduces production time while enabling brokers to create more sophisticated presentations.
Are interactive BOVs becoming the future of CRE listing presentations?
Many industry professionals believe interactive presentations will become increasingly common as technology adoption grows and client expectations continue to evolve.
Key trends driving adoption include:
-
Increased digital engagement
-
AI-powered workflows
-
Better visualization tools
-
Demand for transparency
-
Faster decision-making processes
Conclusion: Interactive BOVs are rapidly moving from a competitive advantage to an expected part of modern brokerage presentations.
What is the biggest mistake brokers make when creating interactive BOVs?
The most common mistake is focusing too heavily on technology while neglecting strategy and usability. A presentation should enhance the owner’s understanding rather than overwhelm them.
Mistakes to avoid include:
-
Overcomplicated interfaces
-
Excessive data visualization
-
Unverified calculations
-
Too many features
-
Weak valuation narratives
Conclusion: Successful interactive BOVs prioritize clarity, accuracy, and strategic insights over flashy design elements.