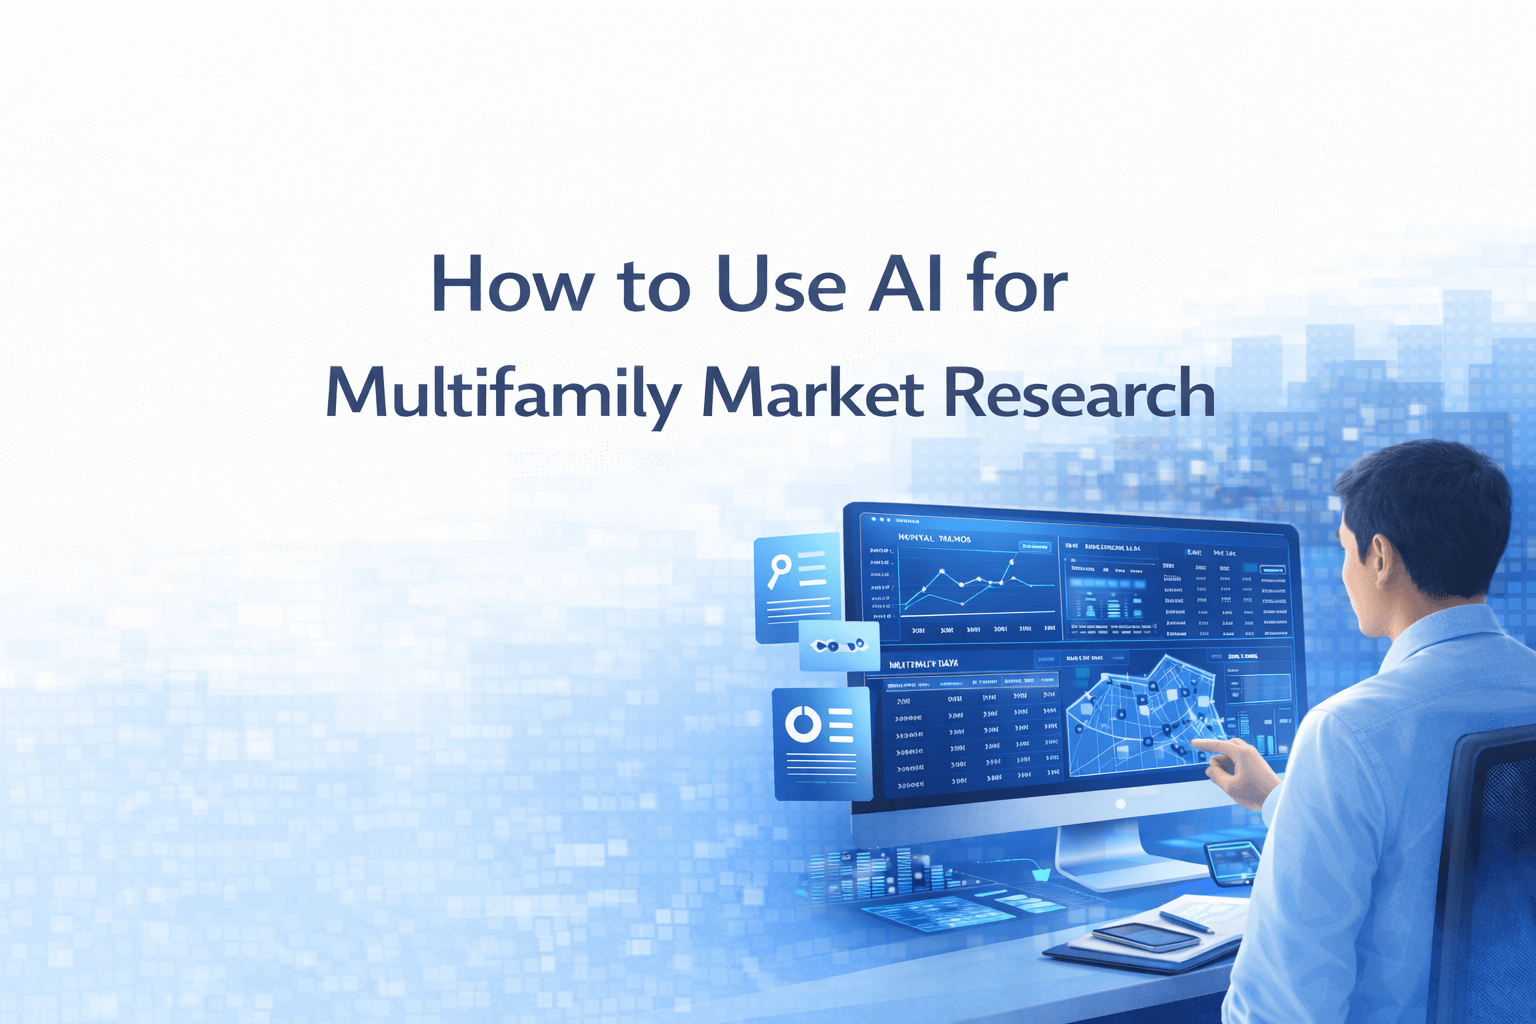
How to Use AI for Multifamily Market Research
AI multifamily market research is transforming how commercial real estate (CRE) professionals analyze markets, evaluate deals, and prepare investment reports. For most CRE professionals, it’s also one of the biggest time sinks. Pulling data from CoStar. Cross-referencing census reports. Scanning transaction databases. Reading city planning documents. Formatting charts. Stitching it all into a presentable market report. A thorough submarket analysis for a single multifamily market can take a full day or more.
I’ve spent the past year testing AI tools for CRE market research, including Perplexity Pro and Claude Deep Research, on real multifamily markets with 540+ members in the AI for CRE Collective. I’ve run the same use cases across multiple AI platforms to figure out what works best, what falls short, and how to produce accurate, actionable outputs. In this guide, I’ll walk you through the exact AI workflows for multifamily market research, including prompts, tools, and real results from the Los Angeles multifamily market, so you can see how AI can optimize your CRE analysis.
Table of Contents
ToggleWhy AI Market Research Matters for Multifamily
The traditional market research process for multifamily CRE hasn’t changed much in a decade. Brokers and analysts log into CoStar or Yardi Matrix, pull rent comps, download transaction data, find absorption numbers, check construction pipeline reports, cross-reference census data, and review city planning documents for zoning updates. Then they spend hours formatting everything into a professional market report suitable for investors or clients.
If you’re thorough, one submarket analysis can take 4-8 hours. Cover multiple submarkets, and the time multiplies. Most CRE professionals I speak with in the AI for CRE Collective do deep market research only quarterly due to the time commitment.
AI for CRE changes the math. What takes 4-8 hours manually can now be done in 3-30 minutes using AI tools like Perplexity Pro and Claude Deep Research, depending on the depth of analysis. While AI output isn’t perfect, it’s genuinely useful for most multifamily market research applications.
Professionals adopting AI aren’t replacing expertise. Instead, they can research any market, any submarket, anytime, without dedicating half a day to manual work.
What You’ll Need Before You Start
Before running your first AI market research report, ensure you have:
-
Perplexity Pro account — for fast, sourced, and visual market overviews (12-month free link in the AI for CRE Collective)
-
Claude account (Pro recommended for Deep Research) — for institutional-grade depth
-
A clearly defined target market — e.g., “Los Angeles multifamily” instead of “Southern California real estate.”
-
A list of metrics you care about — rental rates, vacancy, absorption, cap rates, comparable sales, construction pipeline, regulatory environment
-
5-30 minutes — depending on which AI tools you run and the depth you need
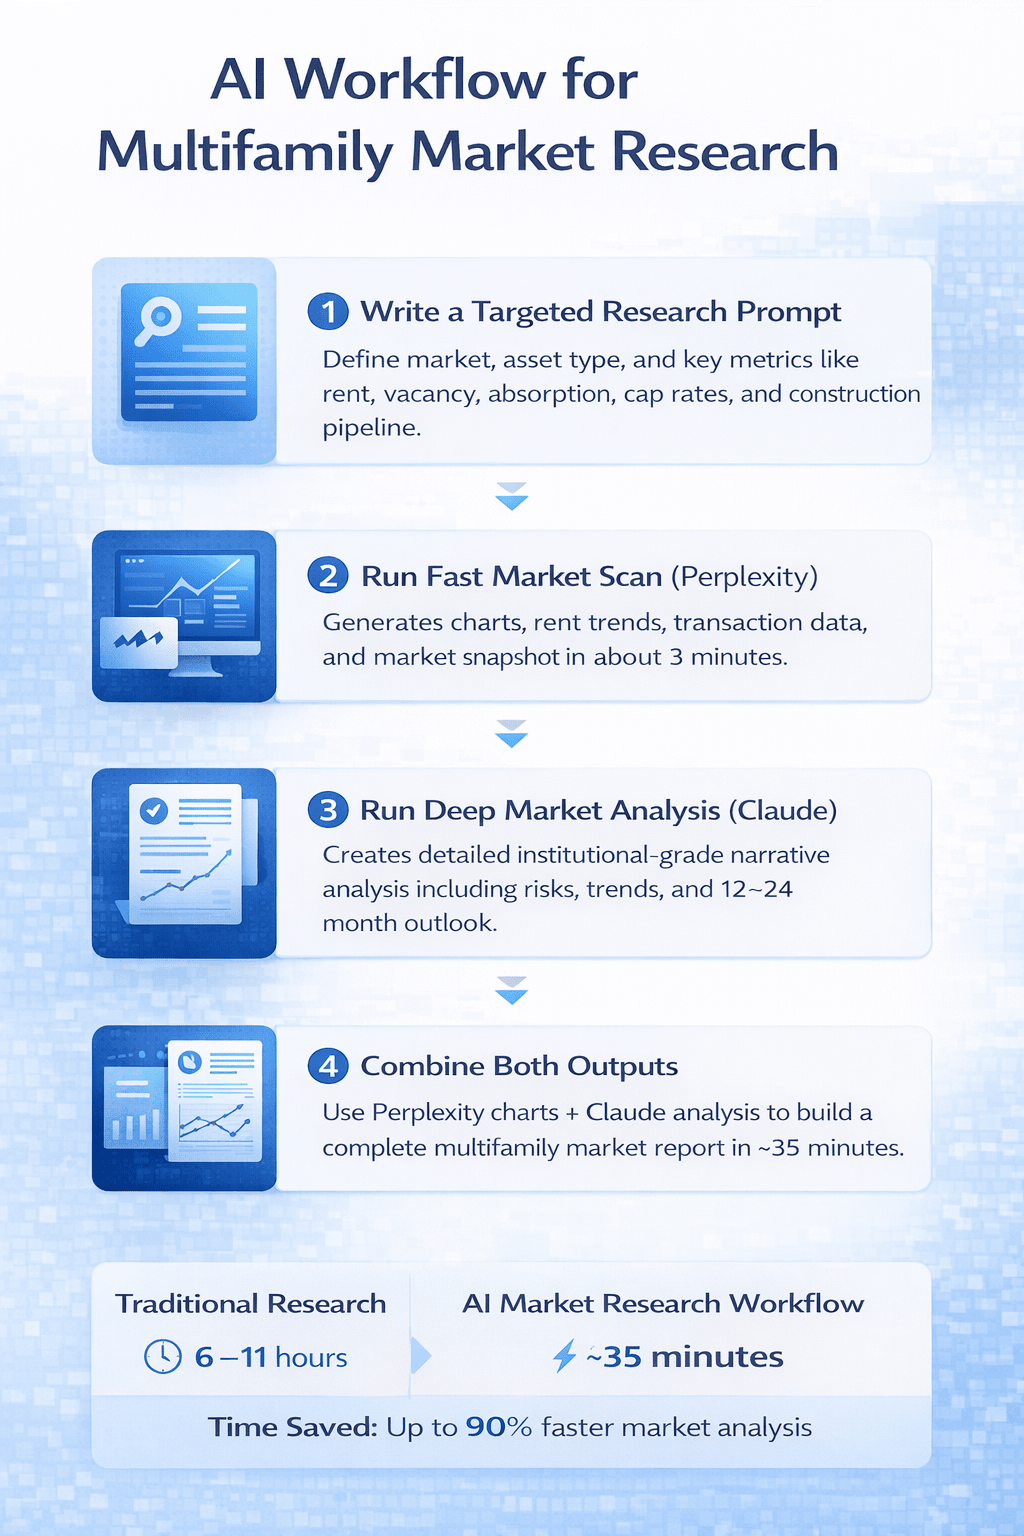
Step 1: Write a Research Prompt That Actually Works
This step determines the quality of everything that follows. A vague prompt produces a vague report. A specific prompt produces usable market research insights.
The “Use AI to Write Your Prompt” Technique
I often let the AI tool draft its own research prompt. With Perplexity Pro, I told it I wanted a comprehensive multifamily market analysis for Los Angeles and asked it to create the prompt. The AI generated a detailed prompt covering:
-
Rental trends
-
Vacancy rates
-
Absorption patterns
-
Comparable sales analysis
-
Cap rate environment
-
Construction pipeline
-
Zoning and regulatory changes
-
Walkability and transit analysis
-
Employment and income trends
-
3-5 year market projections
This ensures your CRE market research report covers everything a human analyst might include.
What to Include in Your Market Research Prompt
Include at minimum:
-
Geographic scope: City, submarket, or MSA
-
Asset type: Multifamily, including property class
-
Time period: Current year or trailing 12 months
-
Specific metrics: Asking rents, vacancy, net absorption, average price per unit, cap rates, construction pipeline, permitting data
-
Output format: Charts, visuals, sourced data, clear sections
-
Audience context: Investor presentation, listing pitch, or internal memo
Go-to prompt structure:
“Conduct a comprehensive and current market analysis for multifamily real estate in [city/submarket]. Cover the following area, the most recent data available: [list metrics]. Include charts and visualizations. Source all data points. Organize the analysis into clear sections suitable for [audience].”
Spending 2 minutes on your prompt saves hours later.
Step 2: Run Your Research with Perplexity Pro
The Process
-
Open Perplexity Pro
-
Paste your research prompt
-
Hit the Research button
-
Wait approximately 3 minutes
Perplexity scans the web broadly. For my LA multifamily example, it pulled data from 127 sources, generating charts and a market snapshot.
What Perplexity Produces
-
Rental data with visualizations (asking vs. effective rents by property class)
-
Absorption and demand trends
-
Comparable sales analysis (median prices, transaction volume)
-
Cap rate breakdowns
-
Construction pipeline and future supply projections
-
Zoning and regulatory insights
-
Walkability and transit scores
-
Local employment and income data
Charts are presentation-ready, ideal for investor decks or OM supplements.
Step 3: Go Deeper with Claude Deep Research
The Process
-
Open Claude (Pro plan)
-
Enable Deep Research mode
-
Paste your market research prompt
-
Wait 15-30 minutes
How Claude Differs
Claude provides institutional-grade narrative analysis. It explains why metrics move, highlights risk factors, and produces multi-page submarket insights. For example, it contextualizes declining, identifies investor trends, and offers a 12-24 month market outlook.
Use Claude when your audience expects depth — investment memos, LP presentations, or lender underwriting support.
Step 4: Combine Outputs for a Complete Package
The most effective workflow:
-
Run Perplexity first — get charts and data overview
-
Run Claude second — get deep narrative analysis
-
Combine — use charts from Perplexity with analytical insight from Claude
Result: a comprehensive multifamily market research report in 30-35 minutes vs. a full day
What the Output Actually Looks Like
From Perplexity (3 min):
-
5-8 presentation-ready charts
-
100+ sourced data points
-
Quick-reference market snapshot
-
Neighborhood granularity
-
Regulatory updates
From Claude (15-30 min):
-
25+ page narrative
-
Submarket deep dives
-
Investment thesis and risk assessment
-
12-24 month market outlook
-
Historical context
Combined:
-
Complete market package for presentations or strategy meetings
-
Visual data backed by narrative
-
All claims sourced
Which Tool for Which Situation
| Situation | Tool | Why |
|---|---|---|
| Client call needing quick data | Perplexity | 3-minute turnaround with charts |
| Screening a new market | Perplexity | Fast overview |
| Investment memo for LPs | Claude | Institutional depth |
| Listing presentation | Perplexity | Charts ready for slides |
| Acquisition committee presentation | Both | Visuals + narrative |
| Quarterly investor update | Both | Complete package |
| Deep underwriting | Claude | Risk analysis and insights |
What AI Market Research Does Well vs. Where It Falls Short
Strengths:
-
Speed: 3-30 minutes vs. 4-8 hours manually
-
Breadth: AI scans sources you might miss
-
Consistency: Same report structure every time
-
Visualizations: Charts ready for presentation
Limitations:
-
Data freshness: Q2 data may lag
-
No proprietary access: Cannot access CoStar or Yardi directly
-
Analysis quality varies: Claude is stronger than Perplexity
-
Occasional errors: Always verify critical numbers
-
Geographic depth varies: Smaller markets may have thinner data
Time Comparison: AI vs. Manual Research
| Component | AI (Perplexity + Claude) | Manual |
|---|---|---|
| Data collection | 3 min | 2-4 hrs |
| Deep analysis | 15-30 min | 2-3 hrs |
| Chart creation | Included | 1-2 hrs |
| Synthesis & formatting | 10 min | 1-2 hrs |
| Total | ~35 min | 6-11 hrs |
Tips from Running 50+ Market Research Reports
-
Let Perplexity complete the full research cycle
-
Use AI to write its own prompt
-
Verify the top 5 data points manually
-
Run separate reports for submarkets
-
Save your best prompts for reuse
FAQs regarding AI for Multifamily Market Research
What is AI market research for multifamily properties?
AI market research uses artificial intelligence tools to gather and analyze multifamily property data quickly and accurately.
-
Scans hundreds of public sources for property, rent, and market data
-
Generates charts, graphs, and visual insights for presentations
-
Produces narrative reports for investment decisions
AI market research supplements traditional CRE research, saving hours compared to manual methods. Learn more here: https://www.perplexity.ai/
Can AI replace tools like CoStar or Yardi Matrix?
No, AI is designed to enhance, not replace, proprietary CRE platforms.
-
Cannot access proprietary lease abstracts or tenant information
-
Supplements CoStar by providing broader analysis, trends, and regulatory context
-
Best used alongside traditional CRE tools for complete insights
Combining AI tools with CoStar ensures comprehensive multifamily research. More details here: https://www.costar.com/
How accurate is AI market research data?
AI data is generally reliable, but should be verified for client presentations.
-
Pulls from multiple public sources for cross-referencing
-
Occasional errors can occur in pricing, absorption, or cap rates
-
Accuracy improves when AI output is reviewed against official data
What are the best AI tools for multifamily market research?
The top AI tools combine speed and depth for CRE professionals.
-
Perplexity Pro: Fast, visual overviews and charts
-
Claude Deep Research: Detailed, narrative-driven institutional reports
-
Both together: Comprehensive reports in about 35 minutes versus 6-8 hours manually
Selecting the right tool depends on the depth and audience of your report. Learn more here: https://www.perplexity.ai/
How much time can AI save in market research?
AI drastically reduces manual research hours.
-
Perplexity: 3 minutes for charts and data overview
-
Claude: 15-30 minutes for narrative analysis
-
Combined workflow: 30-35 minutes for a full market report
What metrics should be included in AI multifamily research?
Key metrics ensure actionable insights for investment decisions.
-
Asking rents and effective rents
-
Vacancy rates by class
-
Net absorption and demand patterns
-
Comparable sales, cap rates, and construction pipeline
-
Regulatory changes, zoning updates, and transit/walkability
Including these metrics gives a complete submarket picture. See sample metrics here: https://www.aiforcrecollective.com/
Can AI produce charts and visualizations?
Yes, certain AI tools like Perplexity Pro generate charts ready for presentations.
-
Rent trends by property class (A/B/C)
-
Cap rate breakdowns with visual overlays
-
Absorption and construction pipeline bar charts
How does Claude Deep Research differ from Perplexity Pro?
Claude provides institutional-grade narrative analysis, while Perplexity focuses on speed and visualization.
-
Claude: 25+ pages of detailed submarket analysis, risk assessment, and outlook
-
Perplexity: Fast 3-minute reports with charts and sourced data points
-
Combining both provides depth and visual impact
Use Claude for LP memos or underwriting support. More info here: https://www.anthropic.com/
How current is AI research data?
AI relies on publicly available sources, which may lag slightly behind real-time.
-
Most metrics (rents, vacancy) are one quarter behind
-
Comparable sales may be based on most recently published quarter
-
For real-time proprietary data, supplement with CoStar or Yardi
Always check dates in your AI report for accurate investor insights. Learn more here: https://www.costar.com/
Can AI help with submarket-level analysis?
Yes, AI can produce granular reports for neighborhoods or submarkets.
-
Separate prompts for Downtown, West LA, or San Fernando Valley
-
Metrics broken down by property class, rent, and absorption
-
Visuals for walkability, transit access, and local regulations
Is AI suitable for investment memos?
Absolutely. AI provides narrative insights and charts suitable for professional memos.
-
Claude produces detailed investment thesis connections
-
Perplexity provides charts for supporting data
-
Combined output is presentation-ready for LPs and committees
How often should AI reports be run?
Frequency depends on market activity and monitoring needs.
-
Monthly for active markets
-
Quarterly for watchlist markets
-
Weekly snapshots are possible with AI speed
Are AI reports credible for investor presentations?
Yes, if data verification is performed.
-
Verify the top 5 key numbers manually
-
Include AI-generated charts and narrative sections
-
Cite sources provided by AI outputs
Can AI research detect regulatory changes?
Yes, AI can scan for zoning, rent control, and permitting updates.
-
Tracks bills like SB 1211 and other local regulations
-
Notes permitting timelines and compliance risk
-
Adds context to submarket investment potential
What are the limitations of AI for CRE?
AI has strengths, but cannot fully replace expert judgment.
-
Limited access to proprietary data
-
Analysis quality varies between tools
-
Geographic coverage may be uneven in smaller markets
Can AI analyze absorption trends?
Yes, AI can identify net absorption patterns
-
Tracks property class-specific occupancy trends
-
Highlights supply-demand imbalances
-
Helps anticipate rent growth or decline
How does AI handle construction pipeline data?
AI scans public sources to provide upcoming deliveries and projects.
-
Bar charts showing under-construction and planned units
-
Predicts impact on vacancy and rent growth
-
Assesses long-term market supply trends
Can AI research improve walkability and transit analysis?
Yes, AI can incorporate location-specific livability metrics.
-
Neighborhood walkability scores
-
Transit accessibility analysis
-
Comparison between multiple submarkets
These insights help evaluate property desirability. Example tools here: https://www.walkscore.com/
How should CRE professionals integrate AI with manual research?
AI is best used as a time-saving supplement.
-
Start with AI-generated charts and narrative
-
Verify top numbers using proprietary sources
-
Use AI outputs to accelerate presentations and memos
Integration leads to more efficient and accurate reports. Tips here: https://www.aiforcrecollective.com/
Can AI predict market trends for multifamily properties?
AI can analyze historical data and current metrics to suggest trends.
-
Rental growth projections
-
Cap rate and absorption forecasts
-
Risk factor identification
Start Using This Today
Access demo videos, prompts, and example outputs inside the AI for CRE Collective. 540+ CRE professionals test workflows weekly. If you want the 12-month free Perplexity Pro link and AI workflow prompts, join the community here.