
AI-Generated Executive Dashboards from Property Reports
Every asset manager has the same monthly ritual. Eight reports hit your inbox—rent roll, P&L, occupancy, budget variance, aged receivables, lease expirations, maintenance logs, and capex tracking. With an AI property report executive dashboard, you can turn these reports into a complete presentation automatically instead of manually building slides.
As a result, you avoid spending hours pulling data, formatting charts, and summarizing insights. I tested this by uploading eight monthly property management reports for a 50-unit apartment building in Los Angeles into NotebookLM, which generated a full executive dashboard with charts, graphs, and action items in minutes.
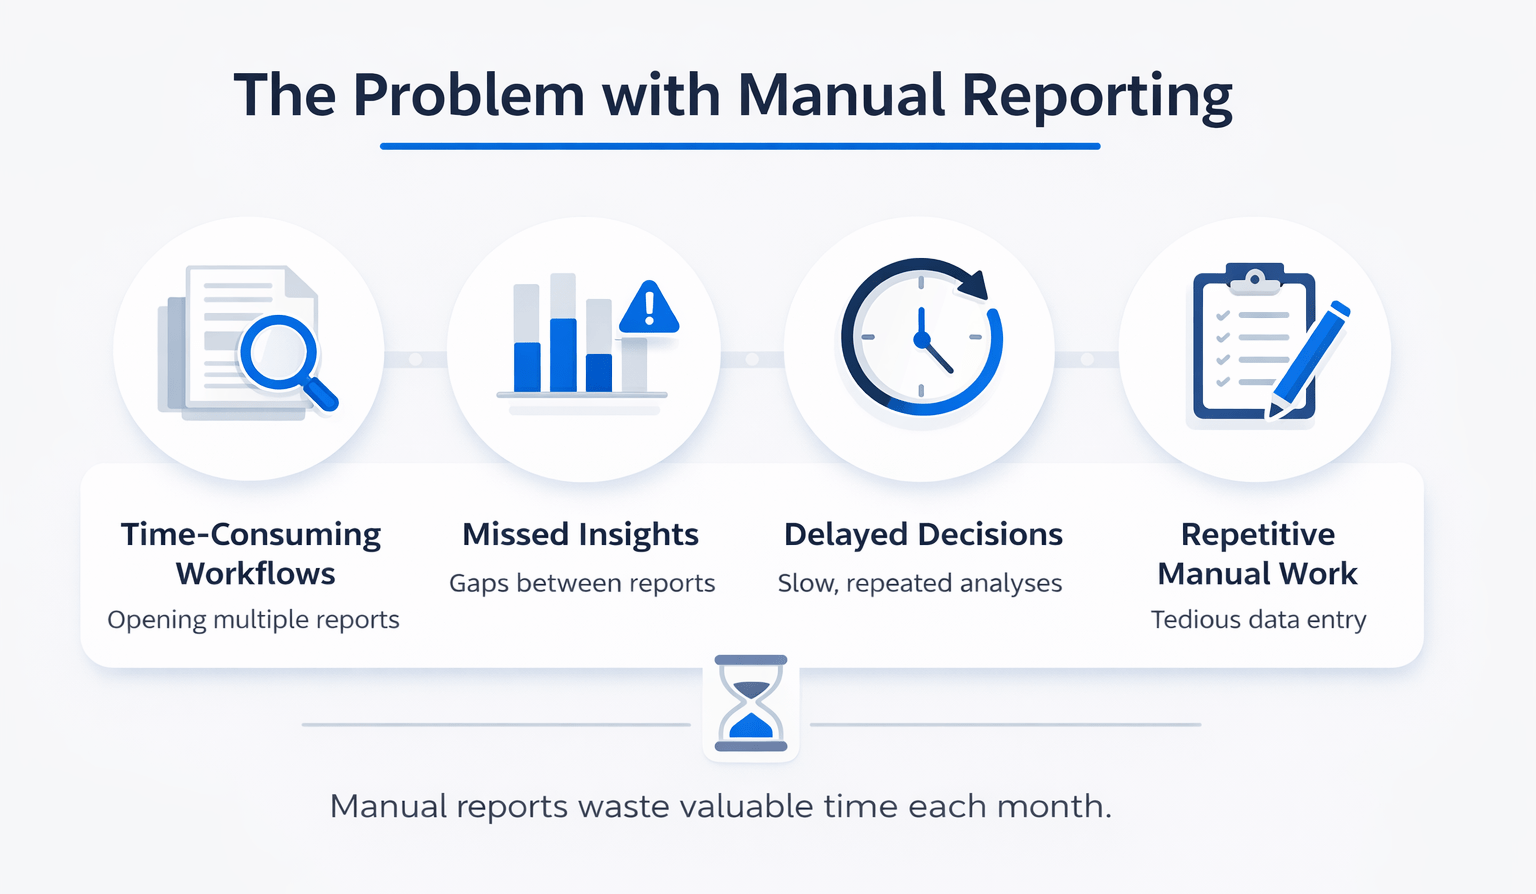
The Problem with Manual Reporting
Monthly reporting typically involves:
- Opening multiple reports
- Extracting key metrics
- Building presentation slides
- Formatting visuals
However, this process creates several issues:
- Time-consuming workflows
- Missed insights between reports
- Delayed decision-making
- Repetitive manual work
Therefore, even experienced asset managers lose valuable time every month.
What NotebookLM Generated from Property Reports
Using NotebookLM, I uploaded eight reports from a 50-unit property (The Palms at Silver Lake).
After selecting Presenter Slides and using a structured prompt, the system generated a full dashboard.
Key Outputs
Executive Dashboard
- Summary slide with key metrics
- High-level portfolio overview
Revenue Bridge Charts
- Breakdown of effective gross income
- Identified vacancy and bad debt issues
Lease Expiration Wave Graph
- Timeline of lease expirations
- Highlighted upcoming risks
Renewal Strategy Matrix
- Categorized renewal strategies:
- Push to Market
- Gentle Bump
- Retention
Maintenance Hotspot Maps
- Identified maintenance clusters
- Linked issues to specific units
Capex vs Opex Analysis
- Compared capital vs operating expenses
- Highlighted cost-saving opportunities
Action Directives
- Organized by category:
- Risk and Legal
- Leasing and Revenue
- Capex
As a result, the dashboard functioned as a complete investor-ready presentation.
Dashboard Output Breakdown
| Component | What It Shows | Value to Investor |
|---|---|---|
| Executive Summary | Key metrics overview | Quick decision snapshot |
| Revenue Bridge | Income gaps and drivers | Identifies revenue leaks |
| Lease Expiration Graph | Lease timelines | Forecasts risk |
| Renewal Matrix | Pricing strategy | Optimizes leasing |
| Maintenance Hotspots | Issue concentration | Improves operations |
| Capex vs Opex Analysis | Cost trade-offs | Supports budgeting decisions |
| Action Directives | Immediate tasks | Enables faster execution |
How to Build an AI Property Report Executive Dashboard
1. Convert Reports to PDF
NotebookLM does not accept Excel files.
- Convert all reports to PDF
- Ensure clean formatting
2. Upload All Files
- Create a new notebook
- Upload all reports
- Remove duplicates
3. Write a Detailed Prompt
Be specific about:
- Audience (owner, asset manager)
- Key metrics
- Required insights
Most importantly:
- Tell AI to connect the dots between reports
4. Generate Presenter Slides
- Select Presenter Slides
- Paste your prompt
- Generate output
5. Review and Refine
- Validate data accuracy
- Adjust visuals if needed
- Customize messaging
Time Savings Comparison
| Task | Manual Process | AI Workflow |
|---|---|---|
| Data extraction | 45–60 mins | Automated |
| Chart creation | 30–45 mins | Automated |
| Slide formatting | 30–60 mins | Automated |
| Total time | 2–3 hours | ~10 minutes |
Overall, this workflow saves significant time every month.
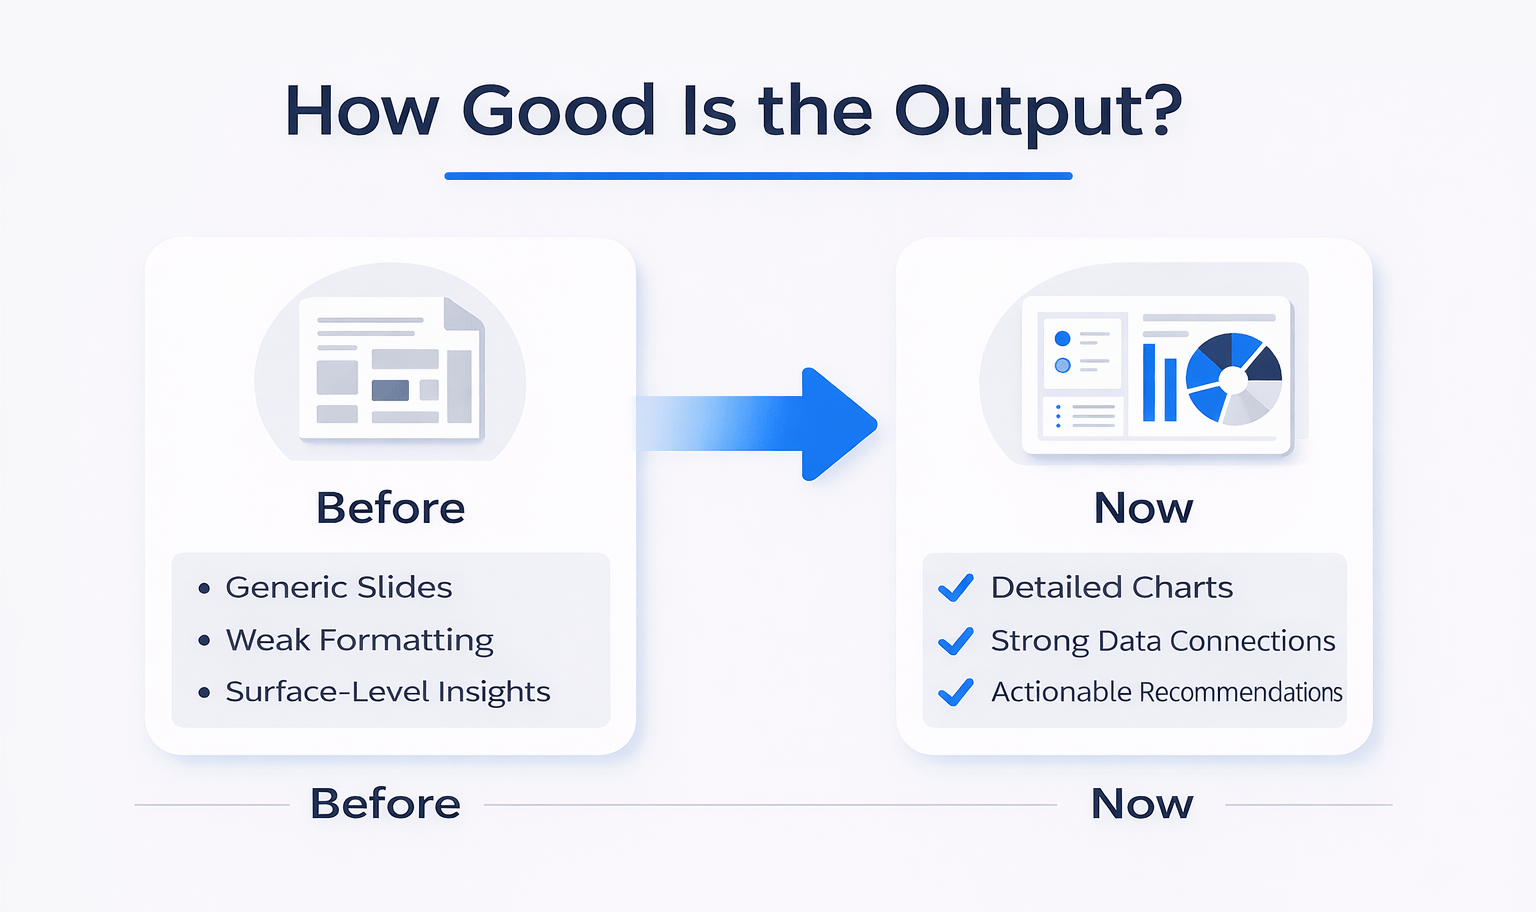
How Good Is the Output?
AI-generated dashboards have improved significantly.
Previously:
- Generic slides
- Weak formatting
- Surface-level insights
Now:
- Detailed charts
- Strong data connections
- Actionable recommendations
However, a review is still necessary before sharing externally.
Combine Slides with Audio for Maximum Impact
While generating your dashboard, also create an audio overview.
This gives you:
- A slide deck for presentations
- An audio briefing for quick consumption
Therefore, you create a complete reporting package in minutes.
Beyond Slide Decks
NotebookLM can also generate:
- Video summaries
- Mind maps
- Reports
- Infographics
- Data tables
- Training materials
As a result, one dataset can produce multiple outputs.
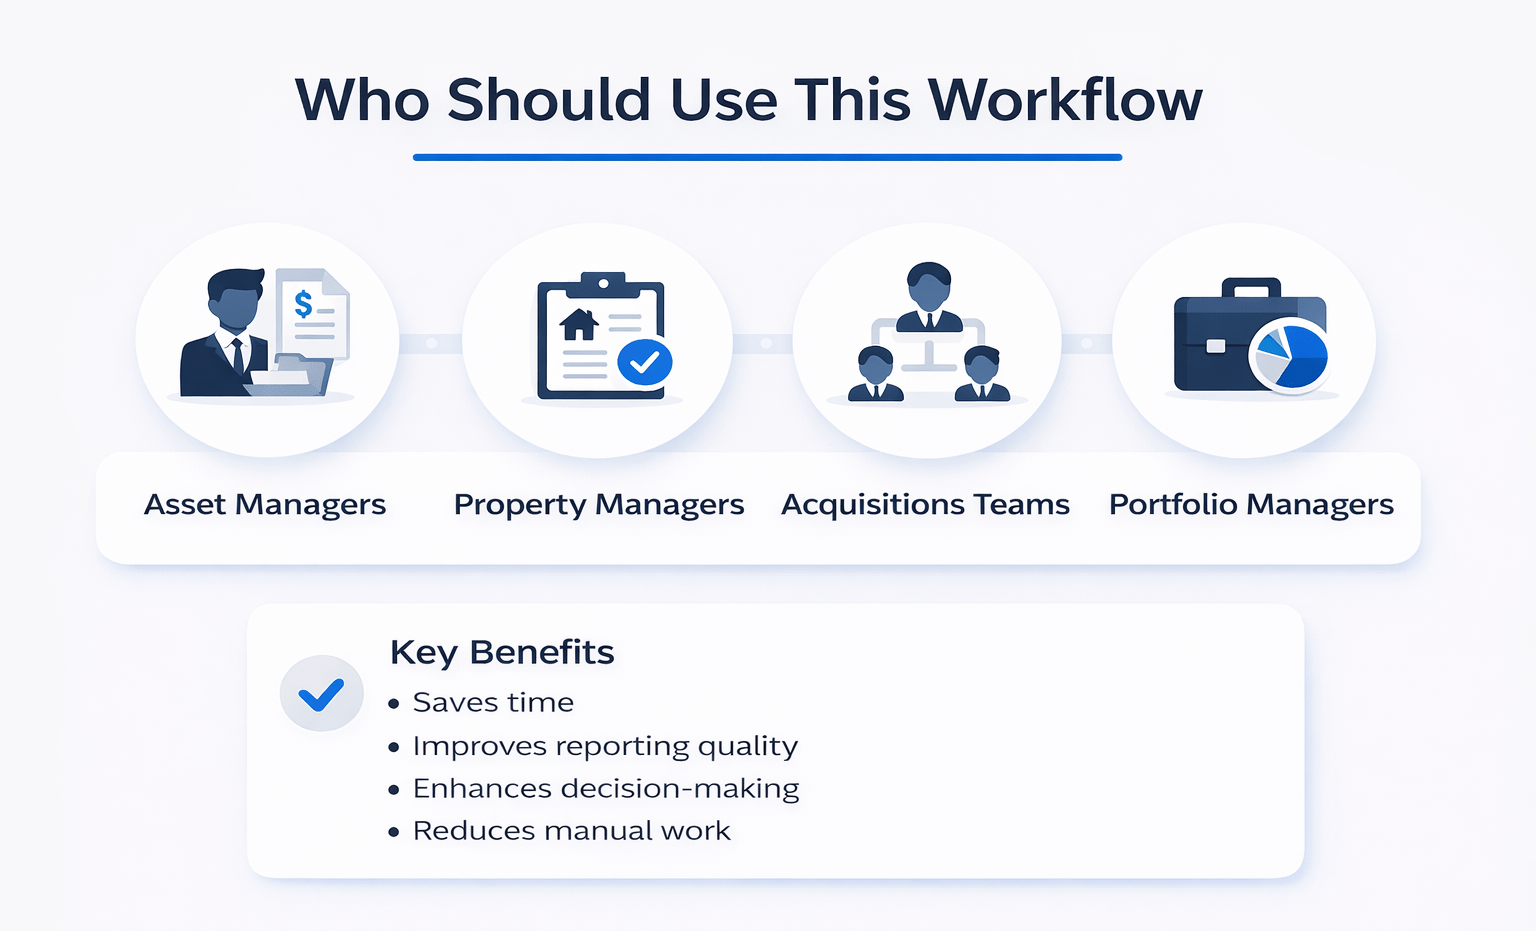
Who Should Use This Workflow
This workflow is ideal for:
- Asset managers
- Property managers
- Acquisitions teams
- Portfolio managers
Key Benefits
- Saves time
- Improves reporting quality
- Enhances decision-making
- Reduces manual work
FAQs Regarding AI Property Report Executive Dashboard
What is an AI property report executive dashboard?
It automatically converts property reports into presentation-ready dashboards.
- Combines multiple reports
- Generates charts and visuals
- Provides actionable insights
It simplifies reporting and improves decision-making.
How does NotebookLM create dashboards?
It analyzes uploaded documents using AI.
- Extracts key data
- Builds charts
- Generates slides
It automates the entire reporting workflow.
What reports are required?
Standard property reports are sufficient.
- Rent roll
- P&L
- Occupancy
- Maintenance logs
Any report converted to PDF can be used.
Why is “connecting the dots” important?
It enables deeper analysis.
- Links revenue to occupancy
- Connects costs to maintenance
- Identifies trends
It turns summaries into insights.
Is manual review still needed?
Yes, always review outputs.
- Verify data accuracy
- Adjust visuals
- Refine messaging
It ensures professional-quality results.
How long does it take to generate dashboards?
Usually, a few minutes.
- Upload files
- Add prompt
- Generate slides
It saves hours compared to manual work.
Can this scale across portfolios?
Yes, it works across multiple properties.
- Portfolio-level insights
- Batch processing
- Standardized reporting
It scales efficiently.
What is the biggest benefit?
The biggest benefit is efficiency.
- Reduces manual work
- Saves time
- Improves clarity
It transforms monthly reporting workflows.
Build Faster Reporting Workflows
Join the AI for CRE Collective, where 600+ CRE professionals are using workflows like this to automate property reporting, eliminate manual slide creation, and generate investor-ready dashboards in minutes.
Get access to real prompts, step-by-step AI workflows, and 12-month Perplexity Pro access—so you can turn raw property data into polished executive dashboards without spending hours every month.